

WNBA betting trends this season point at one gap the betting public keeps missing. Favorites win nearly 68 percent of their games but cover the spread less than half the time. The team you back to win is usually right, and the team you back to cover is usually the other one.
The numbers here come from this season’s results across roughly 137 games of league-wide splits, not last year’s reputations or a single team’s hot streak. Smart Bet Insider reads where the current season points rather than where the names sit. Each pattern below separates what wins games from what cashes tickets.
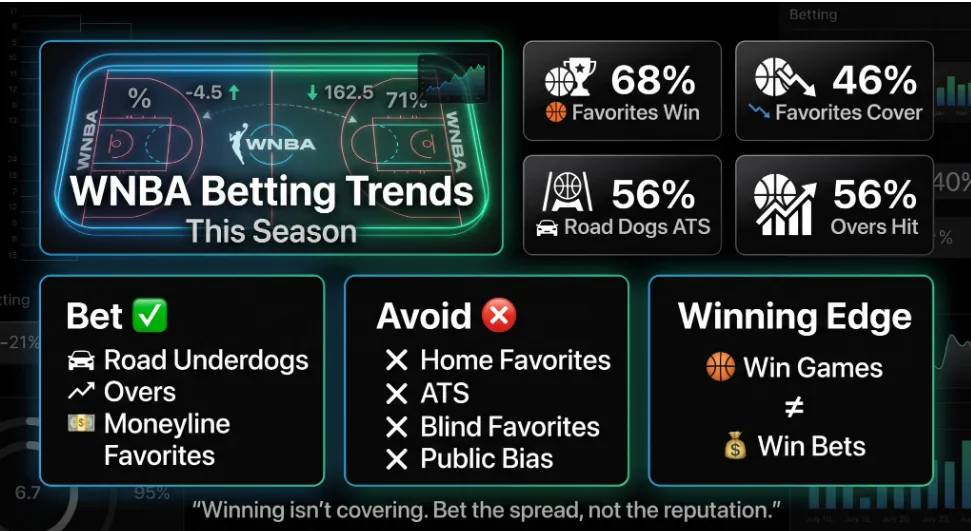
Favorites Win the Game and Lose the Spread
Favorites have gone 93-44 straight up this season, a 67.9 percent win rate, against just 60-72 against the spread. The same teams that win two of every three games cover only 45.5 percent of the time.
The split is the core lesson of the season. Oddsmakers set spreads that account for the favorite’s edge, and the public piles onto the better team until the number stretches past what the margin delivers. Betting WNBA favorites on the moneyline has paid off. Laying the points with them has been a slow bleed.
Away Dogs Are the Best Spread Play on the Board
Road underdogs lead every ATS category this season at 45-36, a 55.6 percent cover rate. The team traveling and getting points has been the most reliable side against the number through roughly 137 games.
The cause sits in how the market prices road teams. A visiting underdog absorbs the public’s instinct to back the home favorite, and the line inflates to match the bias. Away dogs still lose outright far more than they win, at 33.7 percent straight up, but the points carry them past the closing number more often than any other group. The Connecticut Sun riding a 4-1 ATS stretch as home dogs in late June fits the same pattern from the other side.
Home Favorites Are the Spread Trap of the Season
The worst ATS group this season is the one the public trusts most. Home favorites have gone 36-45 against the spread, a 44.4 percent cover rate, despite winning 66.3 percent of those games outright. The crowd, the favorite tag, and the home tag stack into a number too high to clear.
The straight-up record keeps bettors coming back. A home favorite wins two of three, so laying the points feels safe until the margin lands a basket short. The market knows where the public leans and prices the home favorite accordingly, which leaves the cover on the wrong side of the number more often than not.
Away Favorites Win Most and Cover Least
The road-favorite split is the season’s sharpest illustration of the win-versus-cover gap. Away favorites have gone 36-15 straight up, a 70.6 percent win rate that tops every group, yet they sit at 24-27 against the spread, a 47.1 percent cover. They win the most and cover below even.
A team good enough to win on the road is usually good enough that the public hammers it, and the spread climbs to absorb the action. Minnesota has been the exception that proves the rule, sitting a league-best 5-1 ATS as a road favorite, but the league-wide number says the average away favorite is a near-lock on the moneyline and a losing play against the spread.
Totals Lean Over Harder Than the Market Allows
Scoring has pushed the over to a real edge this season. Games have gone over 56.1 percent of the time, a 78-61 split that sits well past the coin flip oddsmakers aim for. The over has been the more profitable side of the totals market through 137 games.
Overtime sharpens the lean. All seven overtime games this season have gone over, which follows since the extra period adds points to a total set for regulation. Even stripping those out, regulation games have gone over 53.8 percent of the time at 71-61. The totals market has leaned over more consistently than the spread numbers alone would suggest.
The Pattern Behind the Numbers
Every current-season trend traces to the same root: the public backs favorites and the market prices that bias into the spread. Favorites win 68 percent of games and cover 46 percent. Home favorites win 66 percent and cover 44 percent. Away dogs lose 66 percent of the time and still lead the league against the number at 55.6 percent. The winning side and the covering side keep coming apart.
Smart Bet Insider tracks these season-to-date splits as they move and flags the spots where the public lean leaves value on the underdog. Check the analysis before you lay points with a favorite the market has already stretched.
Frequently Asked Questions
Are favorites worth betting in the WNBA this season?
WNBA favorites are strong moneyline bets and weak spread bets this season. They have won 67.9 percent of their games straight up but covered just 45.5 percent against the spread. Backing a favorite to win has paid off far more reliably than laying the points with one.
What is the most profitable WNBA betting trend right now?
Road underdogs have been the most reliable side against the spread this season at 55.6 percent, a 45-36 record. The market tends to inflate lines on home favorites to absorb public money, which leaves extra value on the visiting dog. These teams lose outright more than they win but cover the number more than any other group.
Do home teams have an advantage in WNBA betting?
Home teams hold a modest straight-up edge this season at 52.8 percent but offer no spread value, covering just 47.7 percent against the number. Home favorites are the worst ATS group in the league at 44.4 percent. Road teams have been the stronger side against the spread at 52.3 percent.
Should you bet overs or unders in the WNBA?
WNBA totals have leaned over this season at 56.1 percent, a 78-61 split that runs clear of the coin flip. The lean strengthens in overtime, where all seven extra-period games have gone over a total set for regulation. The over has been the more profitable side of the totals market this season.
Why do WNBA favorites fail to cover so often?
WNBA favorites fail to cover because the public consistently backs the better team and pushes the spread past what the margin delivers. Favorites win 67.9 percent of games but cover only 45.5 percent, and home favorites cover just 44.4 percent. The gap between winning and covering is the defining feature of this season’s market.